Wednesday, September 7, 2011

Game Papers at SIGGRAPH 2011 (Part 1 of 2)

Following up on my general impressions of SIGGRAPH I wanted to write about a few of the games paper presentations I enjoyed seeing at the conference.  I paid most attention to the first four talks that were focused on analyzing player behaviour and experience.  This post contains summaries and thoughts on the first two of these papers, and a subsequent post will cover the second two.

Evaluating enjoyment within alternate reality games
[ACM Digital Library] [Direct PDF]

This work is all about formally figuring out what makes an alternate reality game enjoyable.  As explained in the paper:
In our work, we are interested in one specific sub-genre of pervasive gaming known as Alternate Reality Games (ARGs). Layering a fictional world over the real world, ARGs provide an interactive narrative experience played out in the physical world of the player. Although a sub-genre of pervasive games, the emphasis on the narrative experience brings with it even more unique and novel considerations not normally associated with game development.
In particular, narrative is given as a key element to ARGs, unlike in pervasive games in general.  In fact, ARGs are essentially positioned as reality-based interactive story-telling engines, though not in those words: "the game should allow for non linearity in the story structure and contain key user-decision points at which the player will make choices that affect their journey through the story."

The authors propose and test five key principles that they believe are important to player experience in ARGs:
  1. The game needs a strong basic story, a principle generalized from traditional narrative research.
  2. Game content should be split into modular pieces based on the fact that the story is spread out over the real world.  Players should be able to reassemble the pieces in whatever order they wish.
  3. The story pieces should be meaningful in the sense that they are consistent and all play a role in the formation of the game.
  4. Players must be able to interact with the system, and should feel that their interactions affect the game in a meaningful way.
  5. Because the skill required by the game is set by the content alone, it is important to ensure that the content is accessible to a wide audience.
To test a set of eleven metrics that come from these principles, the authors designed two games with similar plots but different narrative structures: one was designed specifically to score well on the metric while the other was designed to score low.  Seven participants consistently ranked the "good" game better than the other one in a statistically significant way.

I hope to use some of the ideas in this paper to give me a starting point in thinking about metrics for narrative in educational games (either in general or for reality-based games).  This may become one facet of my thesis, which I'm thinking will investigate the role of narrative in educational games (i.e. is it useful just for engagement, or for actually facilitating learning, and how does it do this).

Visualizing and understanding players' behavior in video games: discovering patterns and supporting aggregation and comparison
[ACM Digital Library] [Direct PDF]

The motivation for this paper comes from wanting to evaluate how people behave in virtual environments using both quantitative and qualitative methods.  The tool presented makes use of telemetry to track the actions a player takes in a game (such as how often they jumped, how long they spent with a particular non-player character, and so on) for analysis later.

Some of the challenges in designing such a tool include the fact that there is a lot of data to choose from - often terabytes.  You need to have a deep understanding of the game you want to track and analyze.  You need a clear understanding of the questions that should be asked.  Information visualization is a field of its own, and there is the trade-off between flexibility and usability.  The focus of this project was to create a visualization tool that "allows analysts to make sense of telemetry data through visualization and comparison between different player types. By interacting with our system, analysts are able to visualize player actions by cluster or aggregated over multiple clusters."

Some of the interesting features include being able to:
  • cluster data, which is important since gameplay usually does not follow a normal distribution
  • filter data by specifying time windows
  • filter out or superimpose colour-coded event categories
  • provide detail information on demand
  • visualize player progression over time
  • build a story on the data and understand cause and effect

The presentation itself was a nice change of pace in that the speaker demonstrated her tool without using many slides.  I'm pretty picky when it comes to what makes a "good" presentation, so this was nice to see.

In terms of my own research thoughts: it seems like ideas from this paper and the previous might combine in an interesting way.   For example, could using this kind of visualization tool with a narrative-based game help find more useful metrics? How would it help in the educational context I'm interested in?

Monday, September 5, 2011

Techniques for Telling Nonlinear Stories

At the beginning of October, I'll be participating in a digital narrative workshop for the GRAND NCE called 'Experiencing Stories with/in Digital Games.' The following abstract describes a round table talk I'll be giving as part of the student gathering:
Non-linear fiction ranges from the use of static plots with events presented in a non-chronological way to interactive story worlds where users make choices that affect the outcome of the story. A wide range of media can be used to implement works of non-linear fiction, including novels, film, storytelling engines, and games. In all of these cases, there are multiple techniques available for designing and telling a non-linear story.

We have compiled a taxonomy for these techniques with broad categories for strategies for explaining non-linearity, structuring stories as graphs, relying on emergent behaviour, creating character driven plots, and designing data-driven interactive worlds. Each of these categories breaks down further with classic examples from all types of media and with approaches reported on in academic literature. For instance, a strategy to explain a story’s non-linearity is to attribute it to time travel (The Legend of Zelda: Orcarina of Time) or to a hallucinating or brain-damaged character (Memento). Many examples use a simple branching structure to change the story based on player choices (Choose Your Own Adventure) while others rely on game data to adjust how other characters in the story react to you (Fallout 3).

In this talk, we will present our taxonomy and frame it in the context of story in games. We will discuss what techniques have been used in existing games, and which have not yet been employed. We will consider why games have not used certain techniques, and use this to suggest how they might do so in the future.
I'm currently hammering out a potential thesis research plan for myself, and this work will contribute toward that.  I'm really enjoying this whole narrative thread I've embarked on this past summer.

Monday, August 15, 2011

Impressions of SIGGRAPH 2011

Last week I was in Vancouver for this year's SIGGRAPH conference - not presenting, but as a lab trip.  As the website says, the "conference and exhibition is a five-day interdisciplinary educational experience including a three-day commercial exhibition that attracts hundreds of exhibitors from around the world. SIGGRAPH is widely recognized as the most prestigious forum for the publication of computer graphics research."  These are some of general impressions of my first SIGGRAPH experience.

 Fellow lab member Jamie and I outside the convention center.

Location. Being able to stay in Canada was nice for us (especially since we could use our cell phones and data plans).  Getting from the airport to downtown was a matter of taking one train for just half an hour - very convenient!

The convention center was split into two buildings - east and west - but it was no
problem getting between them for what I wanted to do.

Venue. I thought the convention center was amazing.  The rooms were well equipped, the decor was appropriate, there were plenty of washrooms and water fountains, and the views of the water were wonderful.

Exhibition.  I wasn't a huge fan of the exhibition as I personally found it overwhelming and overly commercial; however, for those that like seeing all the newest products and services, and don't mind the scale, it was probably quite good.  It was obvious that much money was spent on the booths there.

SCVNGR. The Google booth at the exhibition advertised  a SCVNGR opportunity to get some Google swag.  I figured it might include actually looking more carefully at some of the other booths there, but that definitely wasn't the case.  In the end I found it to be unclear (I could only win one prize even though there were two rewards listed in the app for SIGGRAPH), and mostly disconnected from the actual location (some of the challenges were just math puzzles).  It didn't enhance my experience at all.

Animation Festival.  One day when I was too tired to take in any more talks, I spent the afternoon watching animated shorts.  I enjoyed this way more than I anticipated! The quality was spectacular and there was much variety in the animation styles and the stories.

Courses.  I took in a couple of courses throughout the week.  I was a little surprised by how little they resembled actual courses.  Instead, they were pretty much a series of lectures on a particular topic.  Huge audiences, no interaction, and not much practicality (though this may have just been what the ones I attended were like).  I still learned a few things, but feel like I could have learned a lot more if the format was closer to a workshop.

Technical paper presentations.  I actually didn't end up seeing a huge number of paper talks since I figured I could read papers later more easily.  The presentations I did see were like most that occur at conferences: not very good.  The expected standard of talks involve text on PowerPoint slides and presenters who forget that oral communication is a very different thing from written communication.  There was one great presentation that I saw, but I will save writing about that for when I do another post about the game papers.

Emerging Technologies.  This was one of my favorite parts of the conference.  There were so many interesting or just plain fun exhibits.  I particularly enjoyed the pregnancy simulator vest that gave the wearer an idea of what a kicking baby and a growing belly and breasts would feel like.  Being that I'm almost five months pregnant myself, I wish my husband could have tried this out. ;)

While the pregnancy simulator suit grows, you see information on the screen that
explains baby's current status each week of the pregnancy.

Art Gallery. This was with the Emerging Technologies.  Some of it was pretty neat, but some of it I didn't really "get."  Art can be like that.  I was most taken by the remote wind exhibit.  The idea was interesting and the result was relaxing to watch.

These wispy grass-like metal structures moved according to how the wind blows in some remote location.

Overall, I liked SIGGRAPH.  I was regretting going at first because we had to leave for our big east coast vacation only 30 hours after I got home from Vancouver, but I'm glad I got to experience it.  Whether I end up back again to present one day or not, it was well worth experiencing this conference at least once.

Friday, August 5, 2011

Our First Ultrasound (Technology is Awesome!)

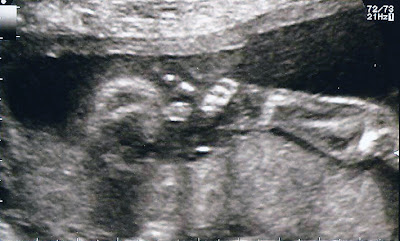
I got my first ultrasound on Wednesday.  Baby was 20 weeks old.  I think the grandparents-to-be were more excited about the baby itself; we just might have been more enthralled with the technology that allowed us to see it.


Still images don't really do these machines justice.  They look a lot less clear than the moving images shown on the screen in real time.  It was fun to watch a very active little baby do everything from yawn, kick and punch, and put its hand on its forehead.

It was almost just as fun to watch the technician do her thing; it was amazing how proficient she was at switching views, making measurements, and replaying the cute things baby did right after they happened (we watched the yawn a few times before moving on, for example).

I have to wonder exactly what has changed in the last few decades to make the technology so much more impressive.  Is it a case of better engineering, and signals the machines send and receive are simply more accurate? Or is there some computer science going on to correct the images as they are formed?

Either way, it's thanks to this super awesome technology that we now have our very first picture of baby giving us the finger.  Granted, this one's not all that high quality, but the zoomed in arm and hand make a memory we'll love having for years to come.

Tuesday, August 2, 2011

Do I Want to Be an Entrepreneur?

Even though it's early, I have been starting to think about what I want to do when I graduate. Teaching is high up there if I can find a good local job doing it, but I have also been toying with the idea of starting something of my own.  But, at this point, I can't quite figure out if I actually want to be an entrepreneur.

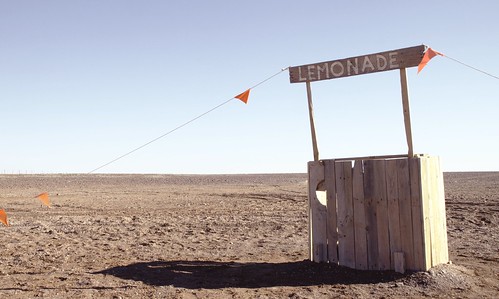
Lemonade, anyone?

Pros: I would be able to combine all of my current passions in a creative way: teaching, outreach, and educational games.  There are several areas of opportunity, from consulting to application development.

Cons: Entrepreneurship takes a lot of time! From what I can see you have to be willing to put in many, many hours, and our lifestyle has been more about balance than working much more than a regular work week.  Plus, there's that whole having a baby thing to throw into the mix.

Just for fun I took this Entrepreneurialist Culture Quotient Test that I found through a friend.  I scored somewhere in between being suited for a regular job and entrepreneurialism - perhaps, it suggested, I should consider a partner.  Hmm...

The pros, cons, and good characteristics to have (written by the same person as the test above) don't seem to make the picture any clearer.  There are as many things that excite me as scare me on these lists.

Luckily, I don't have to decide yet.  Over the next little while, I'm trying to make use of some of the great resources friends have shared to learn more and more about the possibilities.  Before I'm done my PhD I'd like to take advantage of a program like Lead to Win, or perhaps a less "actually start a business when you're done" version of it.  Maybe some business idea competitions (like the Nicol Challenge I participated in this year) would be a good place to test the waters.

Anyway, here are some of the resources I have found so far.  If you have any others, or any advice you can give me, please do share in the comments!